
ट्यूटोरियल, गाइड और संसाधन
डेवलपर ट्यूटोरियल, API तुलनाएं और MapAtlas के साथ निर्माण के लिए हाउ-टू गाइड।

Flock and ALPR Cameras by US State: The Count from OpenStreetMap
How many Flock and ALPR cameras are mapped in each US state: fresh OpenStreetMap counts for all 50 states, per 100,000 residents, and growth since May 2026.
Average Speed Cameras in Europe: How Section Control Works
How average speed cameras work, and where Europe's section controls are: counts per country from OpenStreetMap and our camera index, checked against official lists.
Robotaxi Tracker: Every City with Driverless Taxis (October 2026)
32 cities have robotaxis carrying passengers in October 2026. 17 run fully driverless paid service, none in Europe. Status, rules and a source per city.
As the Crow Flies vs by Road: How Much Longer Trips Really Are
We routed 116 city pairs and compared road distance with distance as the crow flies. The road is 23.5% longer at the median, and up to 2.9 times longer.
Last-Mile Delivery, Measured: Where a Delivery Route Loses Its Time
We routed 30-stop and 60-stop delivery rounds in Madrid, Paris and Amsterdam. Driving is a quarter of the day; parking and the walk to the door take the rest.
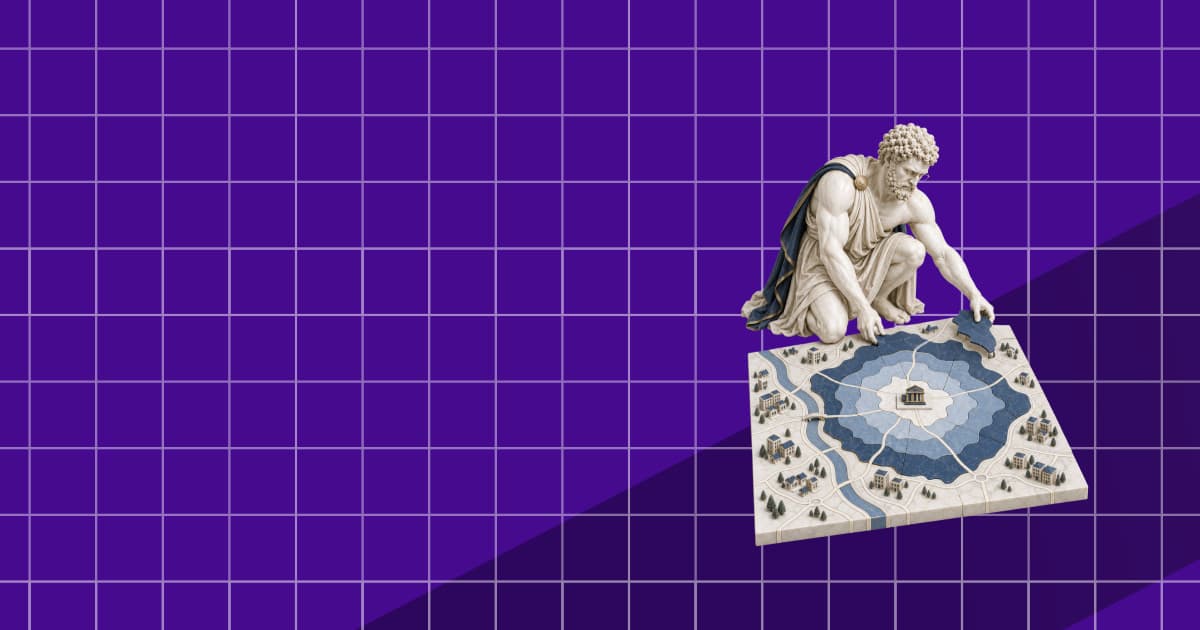
Catchment Area Analysis: Drive Times vs Circles
We drew 10-minute drive-time catchments and 5 km circles around 60 supermarkets in Lyon, Munich and Milan. The circle overcounts residents and reorders sites.
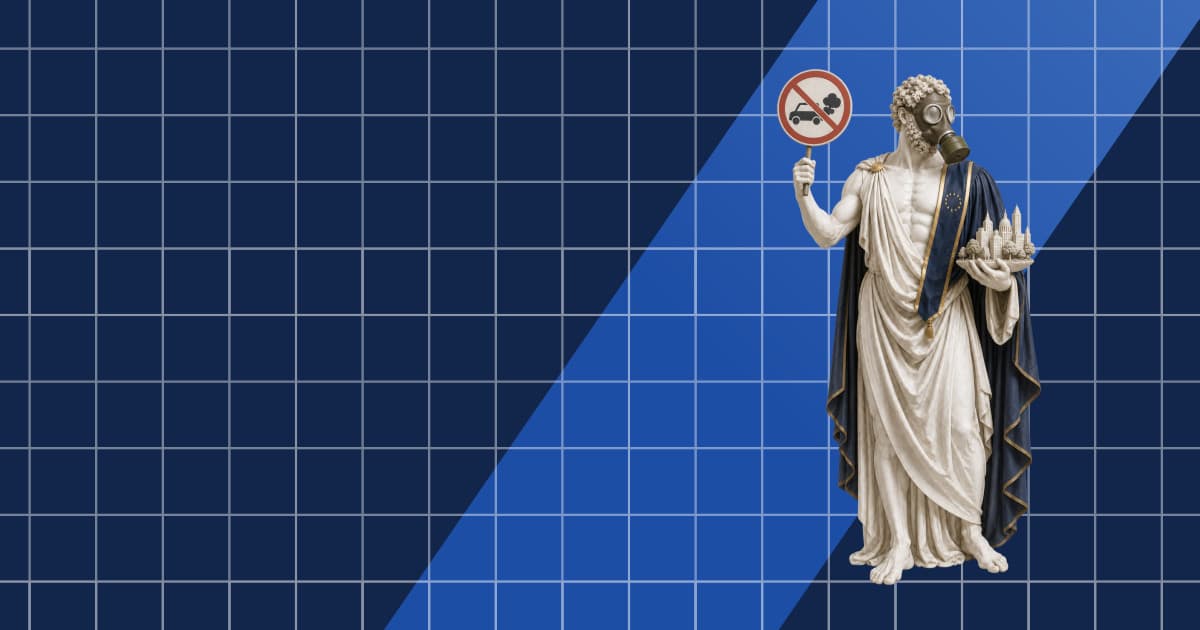
Low Emission Zones in Europe: What OpenStreetMap Maps, Country by Country
OpenStreetMap maps 170 low emission zones in 14 European countries. Counts per country, how they compare with official lists, and how to query them.
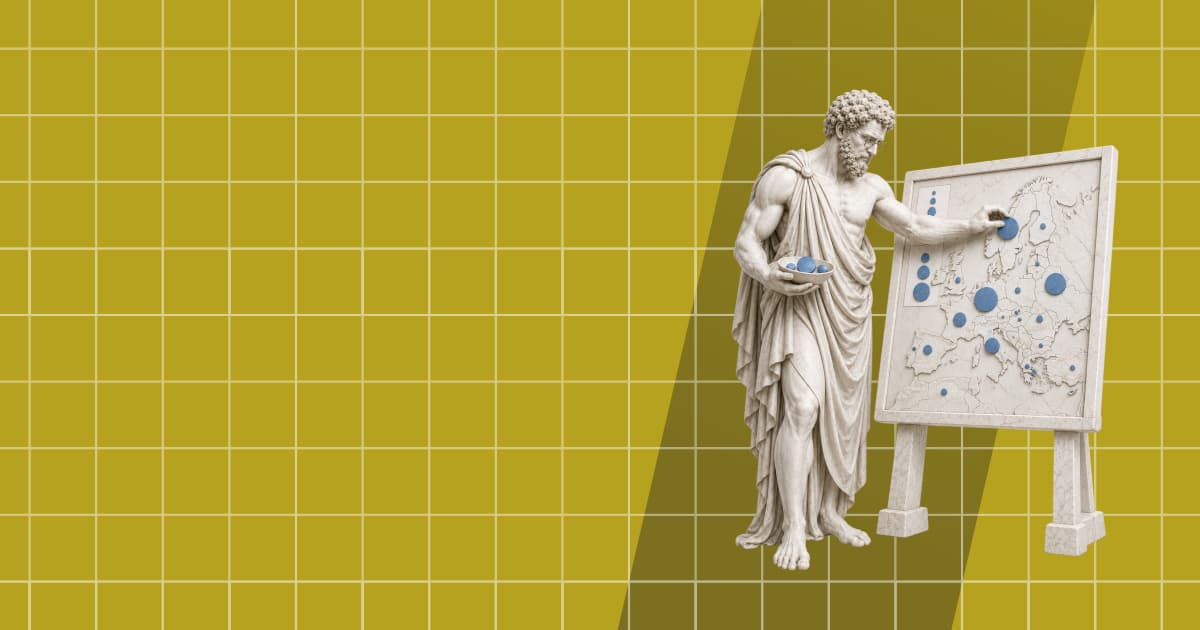
What Is a Proportional Symbol Map? Definition, Graduated Symbols, and How to Build One
A proportional symbol map sizes a circle at each location by a count. How to scale symbols by area, graduated vs proportional symbols, and a MapLibre build.
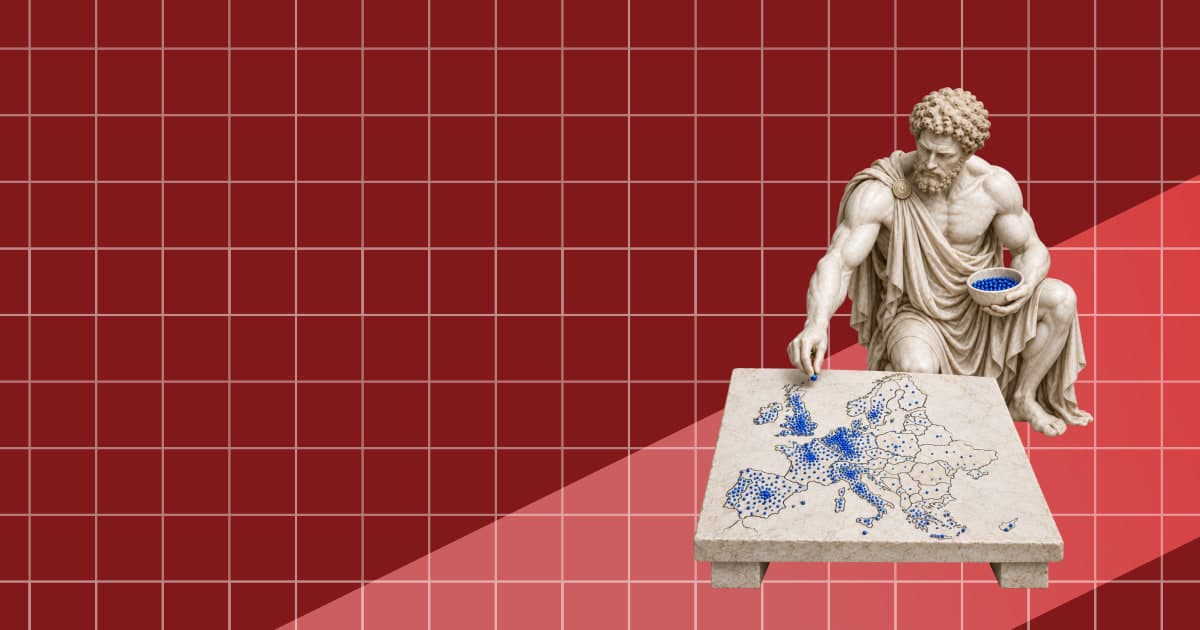
डॉट डेंसिटी मैप क्या है: परिभाषा, उदाहरण और इसे कैसे बनाएं
डॉट डेंसिटी मैप हर इलाके में डेटा की हर तय संख्या पर एक बिंदु रखता है। यह कैसे काम करता है, बिंदु मान कैसे चुनें और वेब मैप पर इसे कैसे बनाएं।