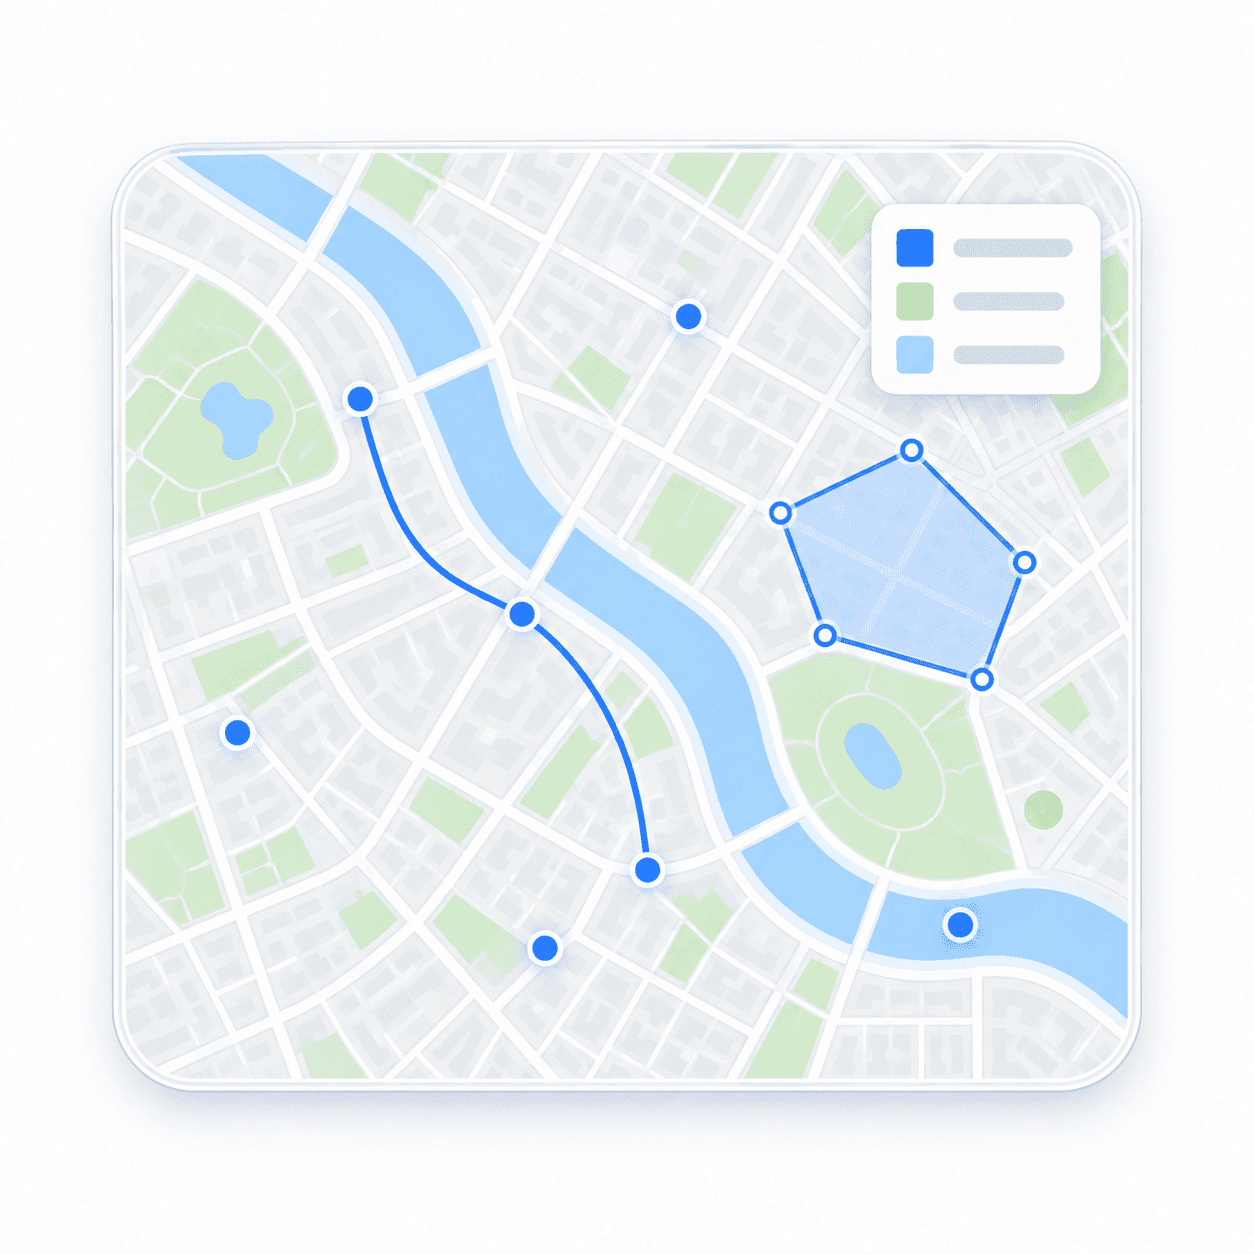
You can style the colours of roads, water, parks and buildings, adjust labels and choose which layers appear. Add your own markers, popups and geographic data to make the map fit your application.
Can I create both light and dark map styles?+
Yes. Use different palettes for different experiences, such as a light map for browsing and a dark map for a dashboard. Try Atlas light, Graphite and Warm ivory in the preview above.
Can I add my own data to the map?+
Yes. Use GeoJSON sources and map layers to display locations, routes, areas and heatmaps. The preview uses illustrative data; your application supplies the locations and attributes you want to show.
Does the preview change the underlying map data?+
No. The presets change the presentation of the same map. Your location and zoom stay in place as you change the palette, labels or visible buildings.
What does “Copy palette JSON” include?+
It copies the colours and layer-visibility choices from this preview. It is a starting point for your own style, not a complete map style file. Your application still needs its map sources, layer definitions and API credentials.
How do I get started?+
Create a MapAtlas account, choose the mapping APIs you need and connect a map to your application. Use the documentation for integration details and the pricing page for current free-tier allowances. Our team can help with styling and data requirements.